Case studies
Three deployments of our software, each set out the same way: context, challenge, what was deployed and what changed for operators. Customer names and site details are confidential.
Airport terminal operations
One video management software (VMS) console for an airport terminal's cameras, with analytics that alert the control room to unattended baggage.
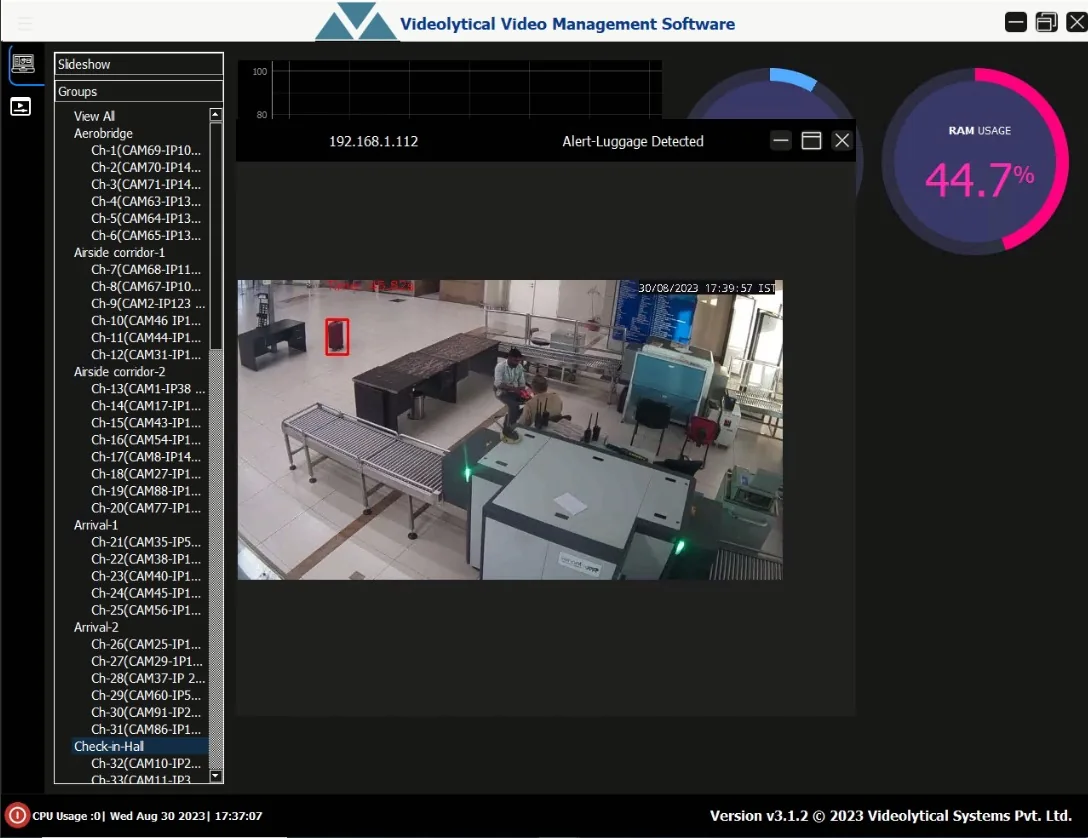
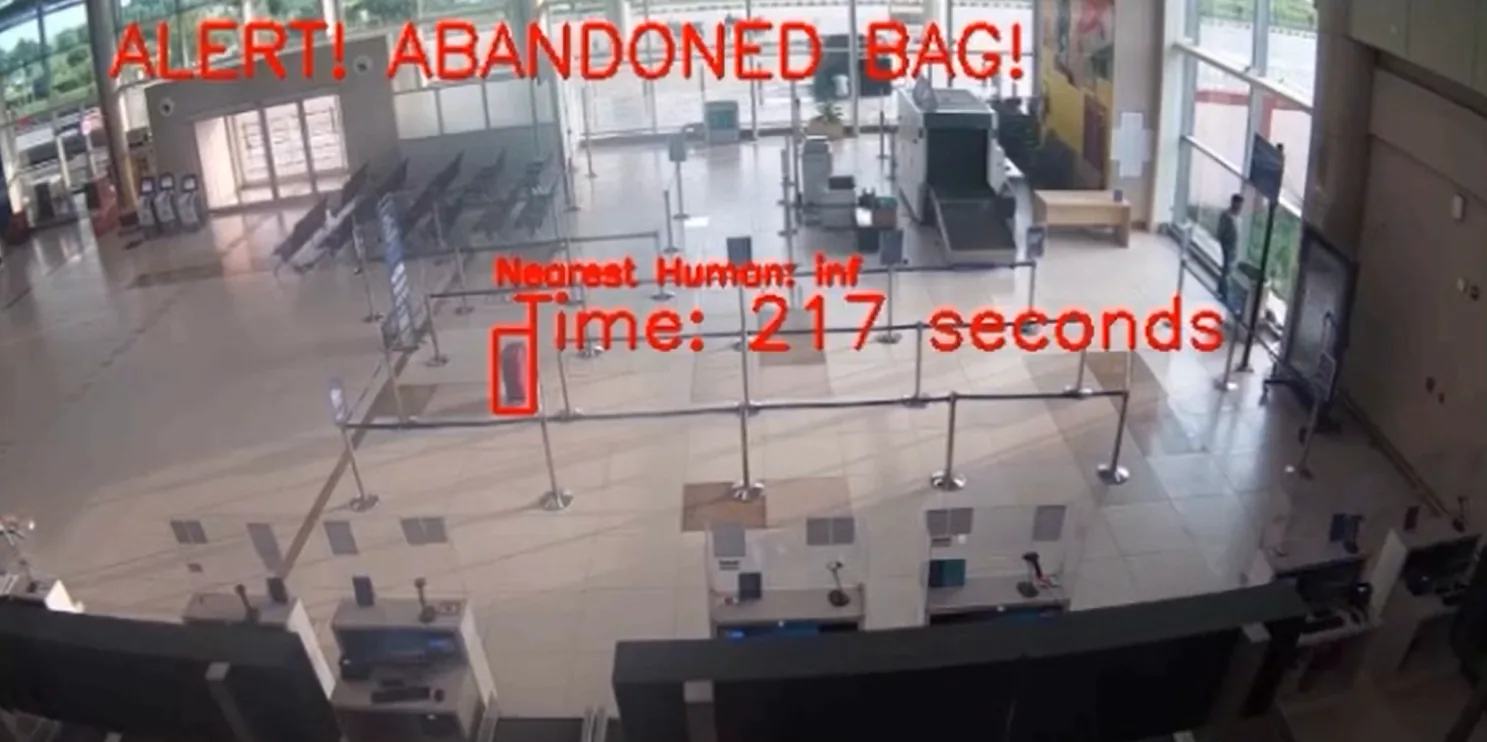
Example analytics output. An abandoned-bag alert is drawn on the camera view of a terminal hall.
- Sector
- Airports and transport
- Site
- Airport terminal, India
- Analytics
- Unattended baggage and crowd monitoring
- Products
- VMS Enterprise and AI Video Analytics
- Context
- A busy Indian airport terminal. Its cameras are spread across the aerobridges, check-in, arrivals and the airside corridors.
- Challenge
- The terminal wanted one console for all of these cameras. It also wanted to catch unattended baggage before it became an incident. In general, a single bag left alone is easy to miss when operators watch many camera views at once.
- What was deployed
- VMS Enterprise is the single console. Cameras were grouped into logical views by area: Aerobridge, Airside corridor, Arrival and Check-in hall. Unattended-baggage and crowd analytics run on servers with graphics processing units (GPUs). Alerts are routed to the terminal control room.
- What changed for operators
- Operators open cameras by area from one console. When the analytics detect an unattended bag, the alert reaches the control room with a video bookmark. A bookmark marks the moment in the recording, so it is easy to find again.
Helmet enforcement on a city highway
Helmet detection for traffic police on a fast urban corridor, with automatic number-plate recognition (ANPR) to capture evidence of each violation.
- Sector
- Smart cities and traffic
- Site
- Fast urban highway corridor
- Analytics
- Helmet violation detection and number-plate recognition
- Products
- ANPR and Vehicle Intelligence
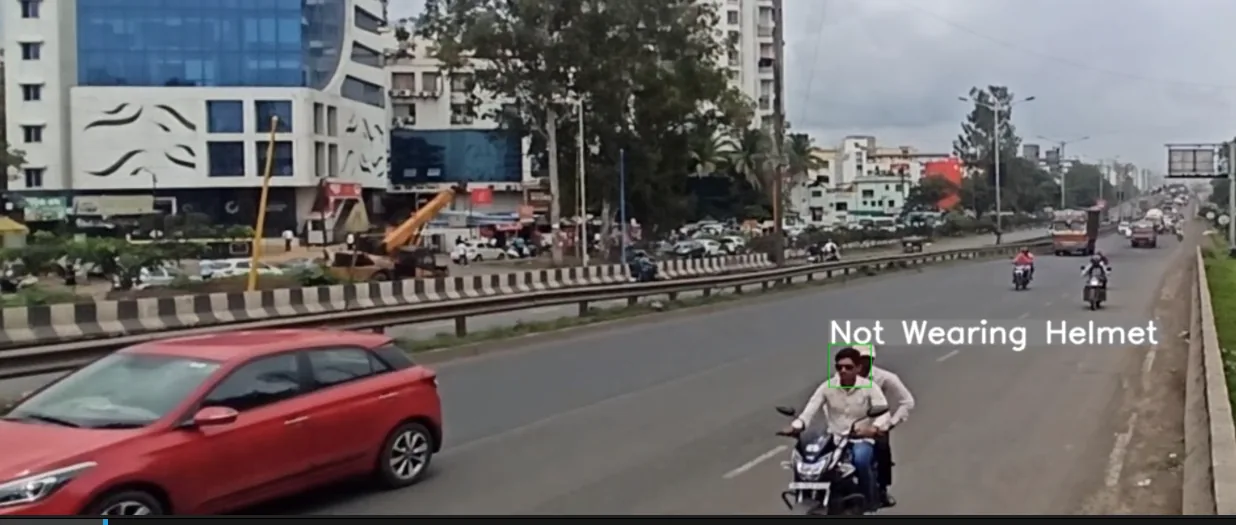
Example analytics output. A rider on a city highway is marked under the on-screen label "Not Wearing Helmet".
- Context
- Traffic police are responsible for a fast urban highway corridor. Riding without a helmet is a frequent violation there.
- Challenge
- Violations were too frequent to monitor manually, and evidence was hard to produce. Enforcement generally needs more than a sighting. It needs a record that ties the violation to a vehicle.
- What was deployed
- Rider helmet detection on the highway cameras, with ANPR evidence capture. Each violation becomes a plate-linked evidence record. The record goes into the automated e-challan workflow. An e-challan is an electronic traffic penalty notice.
- What changed for operators
- Helmet violations are detected automatically on the highway cameras, by day and by night. Each one arrives as an evidence record that already carries the number plate.
Command and control for a defence site
A multi-screen control room for a defence establishment, running inside an air-gapped network.
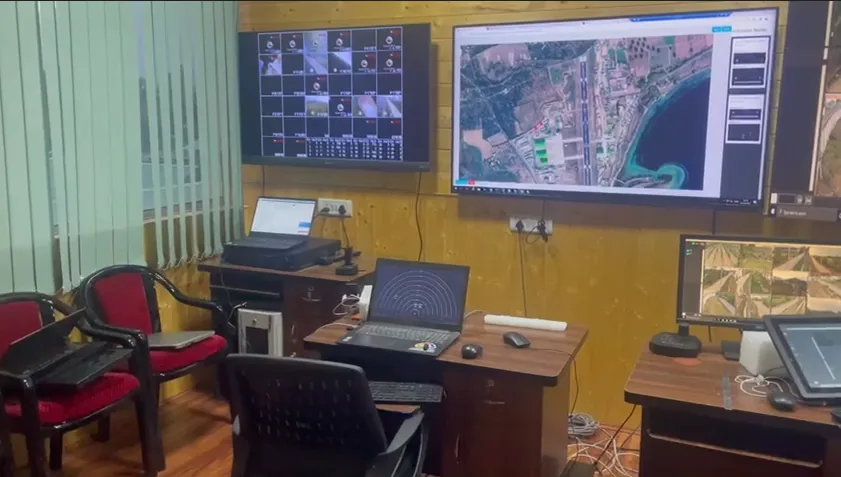
Example of a control room with a wall of camera views and a map display.
- Sector
- Defence and paramilitary
- Site
- Sensitive site, air-gapped network
- Products
- Command and Control
- Context
- A defence establishment with a sensitive site. Its network has no outside connection, and the site has strict audit requirements.
- Challenge
- The establishment needed situational awareness across the site. On an air-gapped network, software cannot depend on a cloud service or an online update. It has to run, and be kept up to date, inside the site.
- What was deployed
- A multi-screen control room built on Command and Control. Camera walls use drag-and-drop layouts. A geographic information system (GIS) map shows cameras and alerts in their positions on the site. Analytics run on an on-premise server, which is updated offline with signed packages.
- What changed for operators
- Operators read video and map together, so an alert comes with its position on the site. The system runs inside the isolated network, and alerts and operator actions are kept in an audit trail.
Customer names and site details are confidential
For security reasons these case studies are anonymous. Customer names and site details are shared only under a non-disclosure agreement. During an evaluation, our solution team can arrange reference calls and site walkthroughs. The images on this page are examples that illustrate the kind of screen, alert or control room described.
Evaluate on your own site
A case study describes someone else's cameras. The useful test is your own scenes, and there are three ways to run it.
- Send a sample clip
- Send a recording from one of your cameras. A difficult view is a good choice, for example one with glare, distance or a dense crowd. We run the analytics you choose and show you what the models detect.
- See a live demo
- Arrange a live demo on footage from your own site, so you see the software working on your scenes.
- Run a pilot
- Start with a small set of your cameras and measure detection on your own scenes. A pilot shows the value before the system is scaled out.
Tell us about your site
Describe the site, the cameras you have and what you want to detect. We can arrange a demo, a pilot or an architecture and sizing discussion.